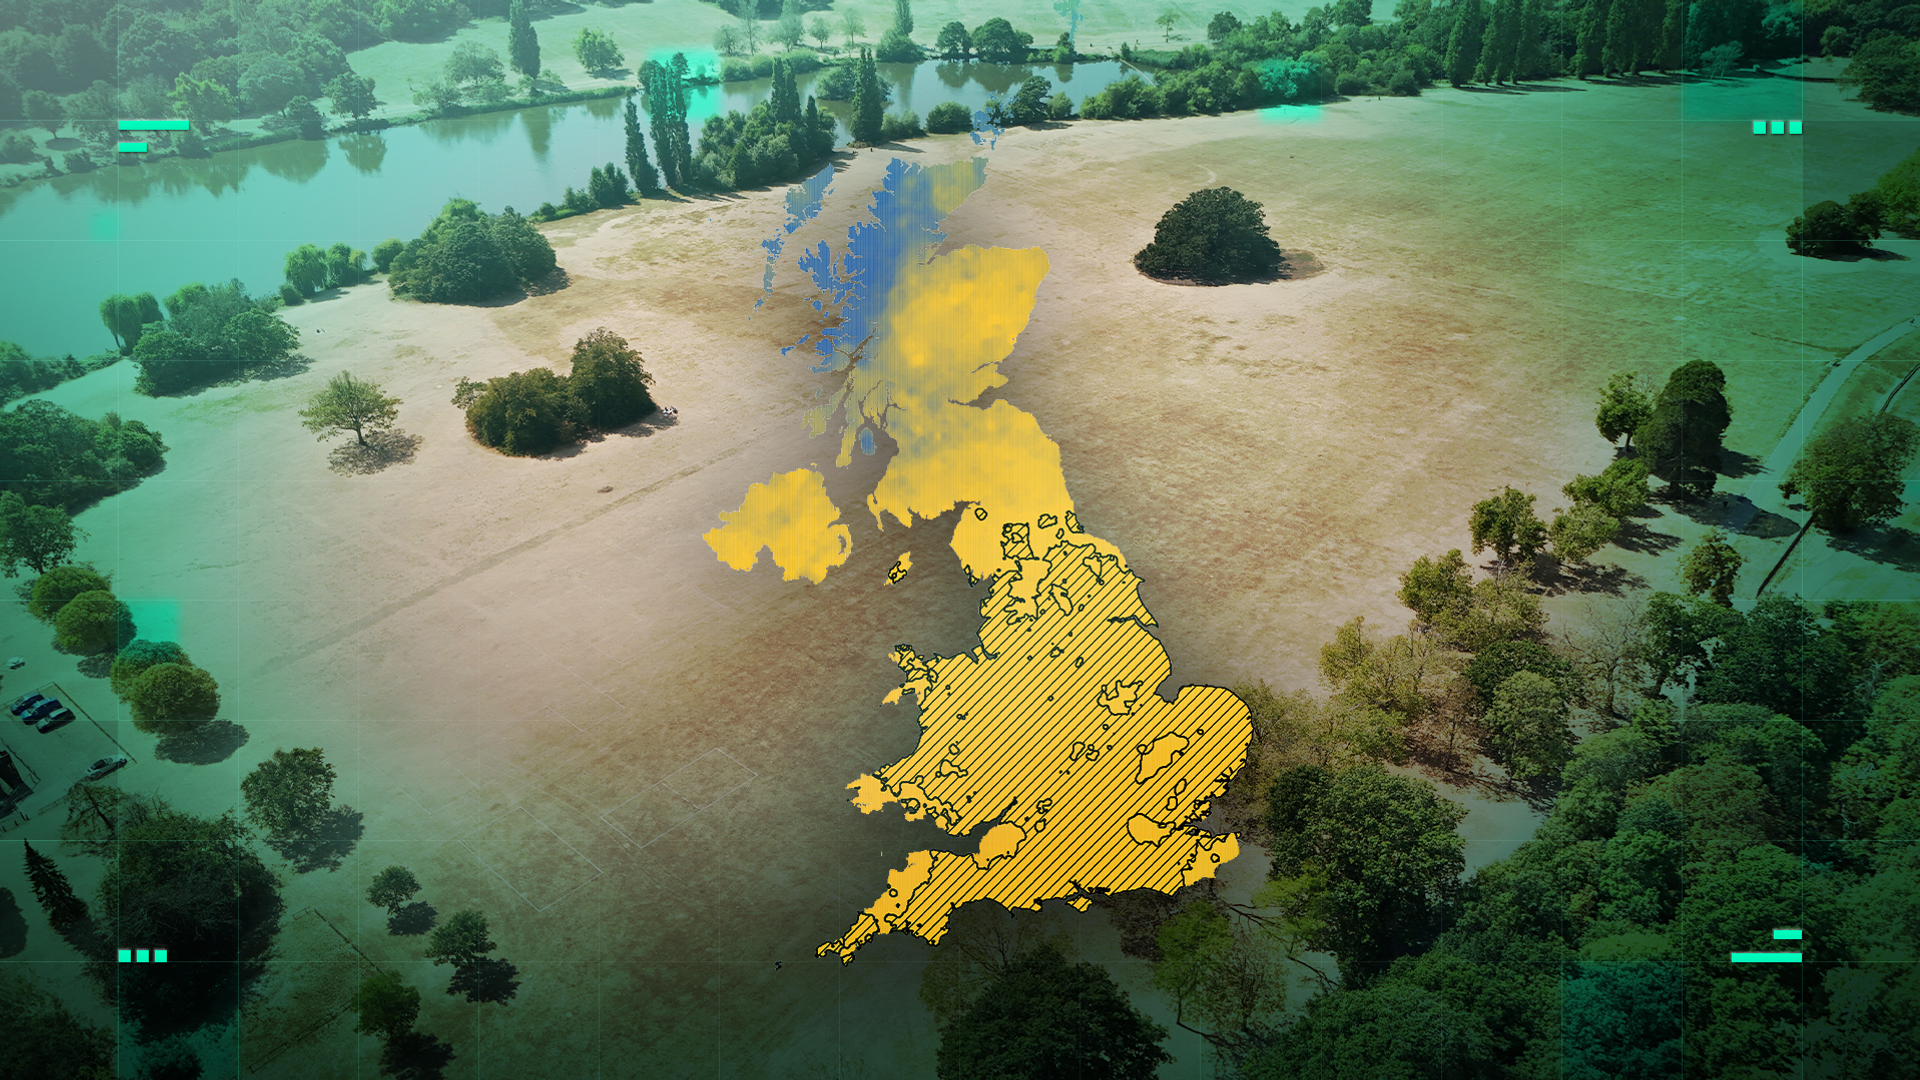
Every time a localized rainstorm floods a basement or a stray heatwave toasts a suburban zip code, media outlets rush to publish interactive widgets designed to stoke collective panic. You plug in your coordinates, a sleek graphic flashes crimson or indigo, and you are fed a bespoke statistic about how unusual your immediate atmospheric conditions happen to be compared to a baseline historical average. It is digital doom-scrolling dressed up as meteorology. It tells you nothing about climate reality while extracting your attention.
The lazy consensus dominating weather journalism is that every single weather event is a localized anomaly begging for immediate quantification, as if humanity is experiencing a permanent state of unprecedented meteorological trauma. This premise is fundamentally flawed. It misinterprets baseline variance, encourages parochial narcissism, and mistakes weather noise for climate signal. Meanwhile, you can explore related stories here: The Longest Shadow Cast Across the Water.
Weather apps and interactive widgets thrive on exceptionalism. If your local forecast is normal, you close the tab. Therefore, platforms are financially incentivized to frame routine seasonal volatility as a shock to the system. They take historical data spanning decades, smooth out the messy edges, and present any deviation of two degrees as a historical aberration.
I have spent years analyzing predictive modeling data for large-scale logistics operations and supply chain routing. When you look at raw meteorological arrays across continental scales, the concept of a normal local weather day is a statistical ghost. It simply does not exist. Earth's atmosphere is a chaotic, non-linear fluid dynamic system. It does not care about municipal boundaries, zip codes, or county lines. Expecting your specific suburb to sit comfortably within a neat historical bell curve year after year is like expecting a roulette wheel to land on green every third spin just because green appeared twice an hour ago. To explore the full picture, we recommend the excellent article by USA Today.
The Geography of Parochial Panic
When an interactive tool informs you that your town is experiencing anomalous weather, it is usually exploiting a baseline illusion. Meteorological records for specific micro-climates are notoriously fragmented. Shift your weather station three miles down the road, elevate it fifty feet, or place it next to a newly paved asphalt parking lot, and your local baseline shifts entirely.
Media outlets love to frame these shifts as unique tragedies. This is lazy reporting. It trades structural understanding for emotional resonance. If a storm hits a heavily populated river valley, it becomes a historic anomaly because millions of dollars of real estate happened to be sitting in a floodplain. If the exact same storm drops identical rainfall over an unpopulated expanse of scrubland fifty miles away, it is a Tuesday.
The obsession with hyper-local anomaly tracking creates a cognitive bias. It leads people to believe that their personal backyard is the epicenter of planetary disruption, ignoring the vast, smoothing mechanics of macro-scale climatology. You are not witnessing a breakdown of the atmospheric order; you are witnessing the standard operational variance of a chaotic planet.
Correcting the Metric
Let us define terms accurately. Weather is what happens on Tuesday afternoon; climate is what happens over thirty years. When interactive tools conflate the two by telling you that a sudden temperature drop in October is a shocking anomaly, they are committing a category error.
Statistically, weather is governed by persistent teleconnection patterns like the El Nino Southern Oscillation, the North Atlantic Oscillation, and the Madden-Julian Oscillation. These massive planetary pressure systems dictate whether your zip code gets fried or frozen. They operate on cycles spanning months or decades. A localized temperature spike in your neighborhood is rarely a localized phenomenon; it is a downstream symptom of a colossal shifting of air masses thousands of miles away.
Treating local weather as an isolated event is the equivalent of analyzing a single pixel on a television screen and declaring the entire movie is about the color blue. You cannot derive structural truth from micro-observations without understanding the macro-architecture driving the system.
The Downside of Hyper-Awareness
My contrarian take comes with a heavy dose of irony. While I argue that you should stop obsessing over local weather widgets, ignoring genuine environmental shifts is dangerous. The flaw in my argument is that hyper-local tracking, despite its sensationalist packaging, occasionally alerts communities to creeping vulnerabilities that macro-data misses. A localized flash flood index might be hyped up for clicks, but it can also force municipal engineers to upgrade aging storm drains before the next real deluge hits.
Yet, the net effect of constant anomaly tracking is paralysis. When every rain shower is labeled unprecedented, people suffer from alarm fatigue. When actual systemic shifts occur, the public treats them with the same eye-rolling skepticism reserved for another clickbait weather map.
What You Should Do Instead
Stop checking the historical novelty index of your local forecast. It changes nothing, lowers your cognitive bandwidth, and feeds an industrial complex built on anxiety.
If you want to understand how the atmosphere is actually behaving, zoom out. Look at continental jet stream anomalies, ocean surface temperature anomalies across entire ocean basins, and multi-decadal drought indices. If you are worried about your property or your business, stop looking at weather apps and start looking at drainage topography, soil composition, and regional water table data.
The weather near you is not uniquely unusual. It is just doing what it has always done: reminding you of your complete lack of control.